
Why Raising Taxes Won’t Fix the Federal Debt: Lessons from History and the Laffer Curve
Editor's Note: The views and opinions expressed in this article are those of the author and do not necessarily reflect the official policy or position of Regent University, its faculty, administration, or affiliates.
Debt and Taxes
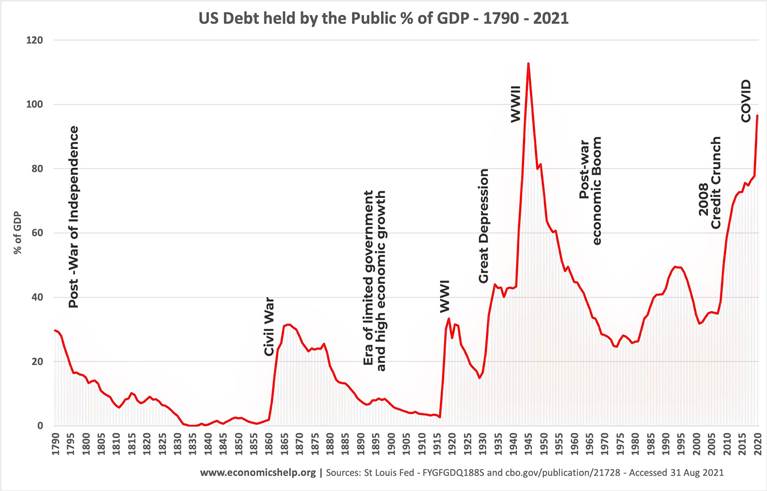
The federal government’s debt is large. Larger than the $36.2 trillion[1] (over 100% of GDP) that is commonly reported because that number does not include unfunded future Medicare and social-security obligations which pushes the figure over $100 trillion.[2] This was not always the case, as the graph[3] below shows.
Former Secretary of Labor and current UC Berkley professor Robert Reich seems concerned. In a recent short article, Reich argues for increased taxes specifically on the wealthy: “[T]here’s a far easier way to reduce the federal debt. Just end the Trump tax cuts that mainly benefit the wealthy and big corporations — and instead raise taxes on them.”[4] Reich is a self-proclaimed Progressive and has always favored increased taxes on the wealthy, without ever defining who exactly are wealthy. But would this actually work? Does government need more money to cover the costs of things We the People want, and would raising taxes on the wealthy provide those funds?
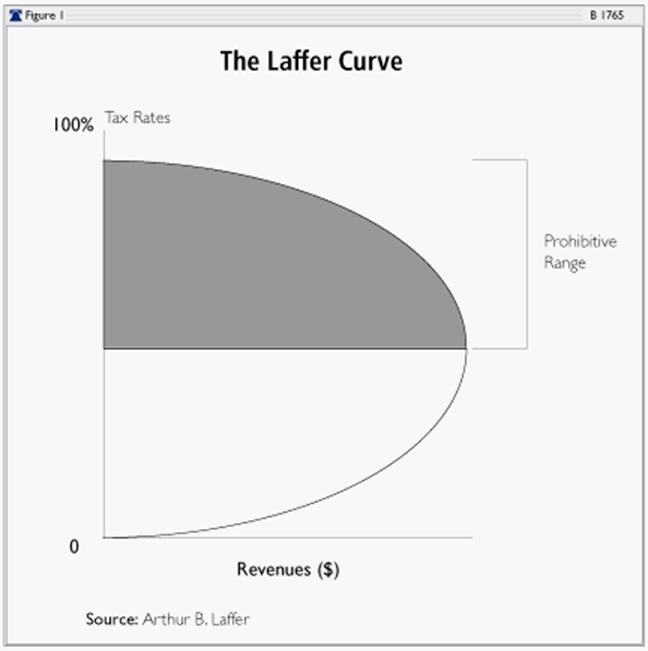
Well, in 1974, economist Art Laffer popularized an idea that pre-dated him, explaining why higher tax rates and higher tax revenues are not that closely correlated. Laffer explained that, if the government raises taxes high enough, it creates incentives for taxpayers to avoid (legal methods) and even evade (illegal methods) paying taxes. But if the rates are low, those incentives disappear, and it is easier and cheaper to pay the taxes.
At the extremes of the Laffer curve, no tax revenue is collected. At one extreme, there would be no taxes collected because the tax rate is 0%. At the other extreme, there would be no tax revenue collected because no one would work if every cent earned was collected in taxes. Somewhere in between is a rate that maximizes collected revenues, and any rate lower or higher results in less revenue collected. The graph below shows how this works.
President Kennedy displayed an understanding of this reality 11 years before Laffer drew his curve by pushing for tax cuts that were eventually enacted after his assassination. But Reich wants none of that, arguing for a return to pre-Kennedy tax rates: “I’m old enough to remember when the U.S.’s super-rich financed the government with their tax payments. Under Dwight Eisenhower — hardly a leftwing radical — the highest marginal tax rate was 91%. (Even after all tax credits and deductions were figured in, the super-rich paid way over half their top marginal incomes in taxes.)”[5]
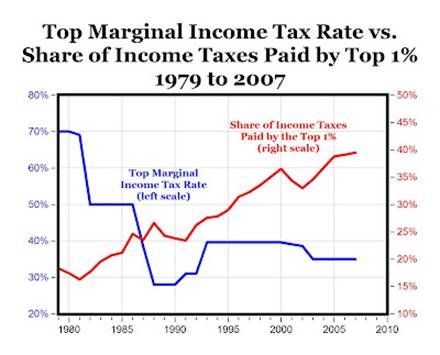
If Reich is correct, then the Kennedy tax-rate cuts (91% to 70%) should have resulted in tax revenue reduction — and so too should have Ronald Reagan’s tax-rate reductions (70% to 28%). That is easy enough to check by observing the graphs below. On the left is a graph of the rates and revenues since 1960. On the right is a similar graph (slightly different years covered) but focused on tax revenues from top earners. Neither shows revenue decreases after a rate decreases.
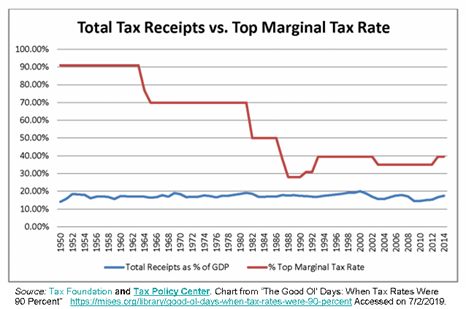
The data shows that no matter the tax rates, 91%, 28% or something in between, the amount of revenue collected has stayed pretty constant — about 18% of GDP. Reich’s solution has been tried. He has nostalgia for 91% rates of the 1950’s, but the government did not collect more revenues under the higher rates.
Reich omits a key point about the 1950’s: The federal government spent a lot less money. Social security did not have many recipients (the “Boomers” were children in the 1950’s) and was fully funded (the government has been using social-security funds for other purposes since the 1960’s, and there is no money in the accounts now), and Medicare did not exist. The federal deficits and debt are primarily driven by these two programs, which comprise a third of the federal budget. See the final graph below.

This is not a philosophical difference or an alternate way to view the economic data, it is straight math and not that complicated: The federal government grows spending faster than revenues collected and has been for most of the past 70 years. Revenues seem pretty constant regardless of tax rates, so the government needs to work with a budget that reflects that reality. All over-spenders face a day of reckoning. Ignoring it will not make it go away. The government’s problem is spending, and the largest categories are social programs. The people and the government have to come to terms with this, or it will smack us hard one day soon.
[1] https://fiscaldata.treasury.gov/americas-finance-guide/national-debt/
[2] https://www.cato.org/blog/medicare-social-security-are-responsible-95-percent-us-unfunded-obligations
[3] https://www.economicshelp.org/blog/3018/economics/history-of-us-national-debt-gdp/
[4] https://businessandamerica.com/the-us-credit-rating-has-been-downgraded-but-theres-an-easy-fix-for-our-debt-robert-reich/
[5] https://businessandamerica.com/the-us-credit-rating-has-been-downgraded-but-theres-an-easy-fix-for-our-debt-robert-reich/